PRML上巻 P15
一昨日の続き.
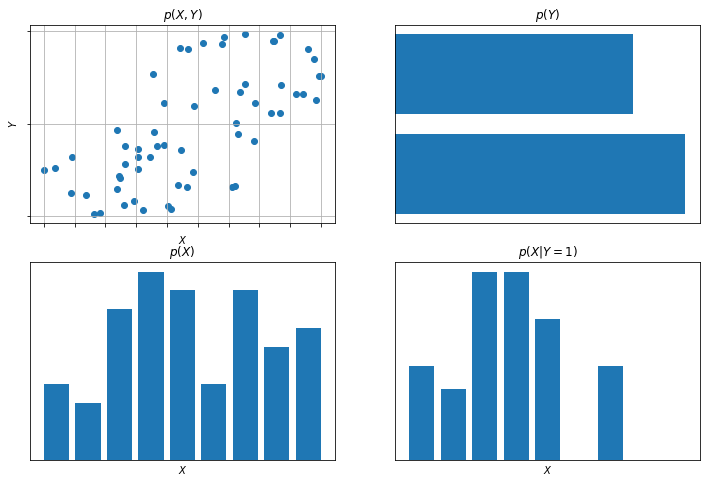
図に,2変数に対する同時分布の単純な例を使って,周辺分布および条件付き分布の概念を図示する.
左上の図は,同時分布からの生成を模して生成した
個のサンプルデータ点をプロットしてある.
残りの図は周辺分布
と,左上の図の下側の行に対応する条件付き分布
のヒストグラムを表す.
%matplotlib inline

import matplotlib.pyplot as plt
import japanize_matplotlib
import numpy as np
np.random.seed(42)
# figure 1.11

def min_max(x: np.ndarray) -> np.ndarray:
    """min-max normalization"""
    n_min = np.min(x) - 0.001
    n_max = np.max(x) + 0.001
    return (x - n_min) / (n_max - n_min)

x = min_max(np.concatenate([np.random.normal(0.3, 0.2, 33), np.random.normal(0.7, 0.2, 27)]))
y = np.concatenate([np.random.rand(33), np.random.rand(27) + 1])

fig, axs = plt.subplots(2, 2, figsize=(12, 8))

axs[0, 0].scatter(x, y)
axs[0, 0].grid(True)
axs[0, 0].set_xticks(np.linspace(0, 1, 10))
axs[0, 0].set_yticks(np.linspace(0, 2, 3))
axs[0, 0].xaxis.set_ticklabels([])
axs[0, 0].yaxis.set_ticklabels([])
axs[0, 0].set_title('$p(X,Y)$')
axs[0, 0].set_xlabel('$X$')
axs[0, 0].set_ylabel('$Y$')

axs[0, 1].set_title('$p(Y)$')
axs[0, 1].hist(y, bins=np.linspace(0, 2, 3), rwidth=0.8, orientation='horizontal')
axs[0, 1].set_xticks([])
axs[0, 1].set_yticks([])

axs[1, 0].set_title('$p(X)$')
axs[1, 0].hist(x, bins=np.linspace(0, 1, 10), rwidth=0.8)
axs[1, 0].set_xticks([])
axs[1, 0].set_yticks([])
axs[1, 0].set_xlabel('$X$')

axs[1, 1].set_title('$p(X|Y=1)$')
axs[1, 1].hist(x[:33], bins=np.linspace(0, 1, 10), rwidth=0.8)
axs[1, 1].set_xticks([])
axs[1, 1].set_yticks([])
axs[1, 1].set_xlabel('$X$')

ヒストグラムは,ある確率分布から生成した有限個の点だけが与えられたとき,もとの確率分布をモデル化する単純な方法とみなすことができる.
今日はここまで.